Thursday, December 20, 2018

How to run the shell scripts through the Jenkins Pipeline

It is a very common requirement to run shellscripts at a step of Jenkins Pipeline. Today I would like to introduce the Jenkins Plugin "SSH Pipeline Steps" which makes your life much easy to call a shell script at your Jenkins pipeline. It can upload/download files from the remote machines, and it can also run commands or shell scripts on that machine. Each function will start a session to do the work and close the session after work.

Below are the functions in this plugin:
  • sshCommand: Executes the given command on a remote node.
  • sshScript: Executes the given shell script on a remote node.
  • sshGet: Gets a file/directory from the remote node to current workspace.
  • sshPut: Puts a file/directory from the current workspace to remote node.
  • sshRemove: Removes a file/directory from the remote node.
Let's see how could we use it in Jenkins Pipeline script.

step 1. Install the plugin into your Jenkins.
step 2. Create a new pipeline job.
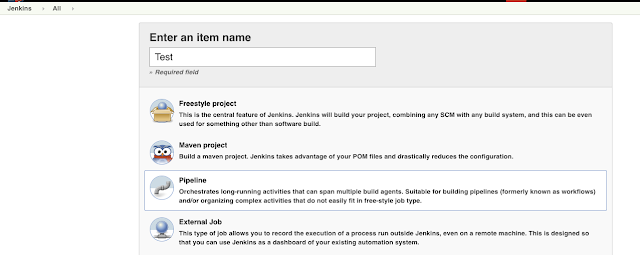

step 3. Choose definition as Pipeline script, where we can test scripts with this plugin


step 4. create pipeline script

node {
            stage('test plugin') {

           }
}

step 5. to use the plugin functions, we need to create a remote variable first. Let's create the remote variable.

node {
            def remote = [:]
            remote.name = 'testPlugin'
            remote.host = 'remoteMachineName'
            remote.user = 'loginuser'
            remote.password = 'loginpassword'
         

            stage('test plugin') {

           }
}

The remote variable is a key/value map, it stores the information that the functions will use.

step6. call the remote function.

node {
            def remote = [:]
            remote.name = 'testPlugin'
            remote.host = 'remoteMachineName'
            remote.user = 'loginuser'
            remote.password = 'loginpassword'
         

            stage('test plugin') {
                  sshPut remote: remote, from: 'test.txt', into: '.'
                  sshCommand remote: remote, command: "ls"               
           }
}
    
In this sample, we first upload the test.txt file from jenkins machine to the remote machine at /home/loginuser, and then we run the shell command ls to see whether or not the file exists.

This is a basic sample for using the SSH Pipeline Steps, for further information, please refer their git.

Little Tips: because the plugin command will close the sessions and disconnect from the machine, it will automatically end the running of the process it initialized. To make the thread keep running during the whole pipleline lifecycle, you will need to use "nohup" command. Next chapter, I will talk about how 'nohup' command works.

Tuesday, October 30, 2018

Code Coverage - How to On-the-fly instrumentation for Jacoco

Code coverage shows which lines of the code have been executed by the tests. A high test coverage could not guarantee a high quality of project but at some point it suggests that there is a lower chance of containing undetected software bugs.

For Java project the best way to measure the code coverage is through the instrumenting the code. There are different ways to do the instruments.

Offline instrumentation VS On-the-fly instrumentation

Offline instrumentation is a way through injecting the data collector calls into the source code or byte code. It usually works side by side with the project and does the modification at compile time. In my previous blogs, I described on how to configure the Jacoco for maven projects which is a typical example for offline instrumentation.

While the On-the-fly instrumentation does the instrument at a lower level like classes loader, usually through a Java agent. Today we will talk about how to do the Jacoco on-the-fly instrumentation.

Who will be benefit from the On-the-fly instrumentation

The On-the-fly instrumentation is very useful if your integration test is not located with the Dev project. The instrument will happen at the server machine and give out the code coverage report after running the integration test against it.

How to do the On-the-fly instrumentation for Jacoco

Jacoco is using the Java agent mechanism for in-memory pre-processing of all classes files during class loading. For details, please refer the Official Document for it.

Step 1. copy the jacoco agent file from official site to your machine.
Step 2. set the JAVA_OPTS to include the jacoco agent configuration. Let's learn the configurations from the sample:

"-javaagent:/jacocoHomePath/jacocoagent.jar=output=tcpserver,address=testerMachineAddress,port=8084,includes=com.testjacoco.*"

In this configuration, we have set up 4 parameters: output, address, port and includes. This one is setting up jacoco agent as a TCP  socket server, so the external tools such like jacococli can connect it through the configured port to dump the code coverage data. And you can use includes/excludes to manage the files on which you want to have the code coverage data.

The official site has mentioned that Jacoco provides three different modes for execution data ouput:
  • File System: At JVM termination execution data is written to a local file.
  • TCP Socket Server: External tools can connect to the JVM and retrieve execution data over the socket connection. Optional execution data reset and execution data dump on VM exit is possible.
  • TCP Socket Client: At startup the JaCoCo agent connects to a given TCP endpoint. Execution data is written to the socket connection on request. Optional execution data reset and execution data dump on VM exit is possible.
If you don't know how to set up the java opts for web service, this document have details for Tomcat and Jboss.

Step 3. restart the service and run the test against it.
Step 4. collect the code coverage by using tool jacococli. Sample command like below

"java -jar ~/Downloads/temp/lib/jacococli.jar dump --address testerMachineAddress --port 8084 --destfile jacocoTest.exec"

Now you will get your data coverage file to your local machine.